COVID-19 in Texas
epilogue
These used to update every day. Since they're manually entered by county in to an excel sheet, the reporting rules, formatting, and organization would regularly change, requiring more hacking to get the graphs to work. I would rate the effort and quality of reports to be quite poor.
Some charts on COVID-19 to explain how we know the state of COVID in the area.
This is also a good dataset to try and make plenty of nice charts with python and plt.xkcd() influencedy by Edward Tufte but with too much chartjunk.
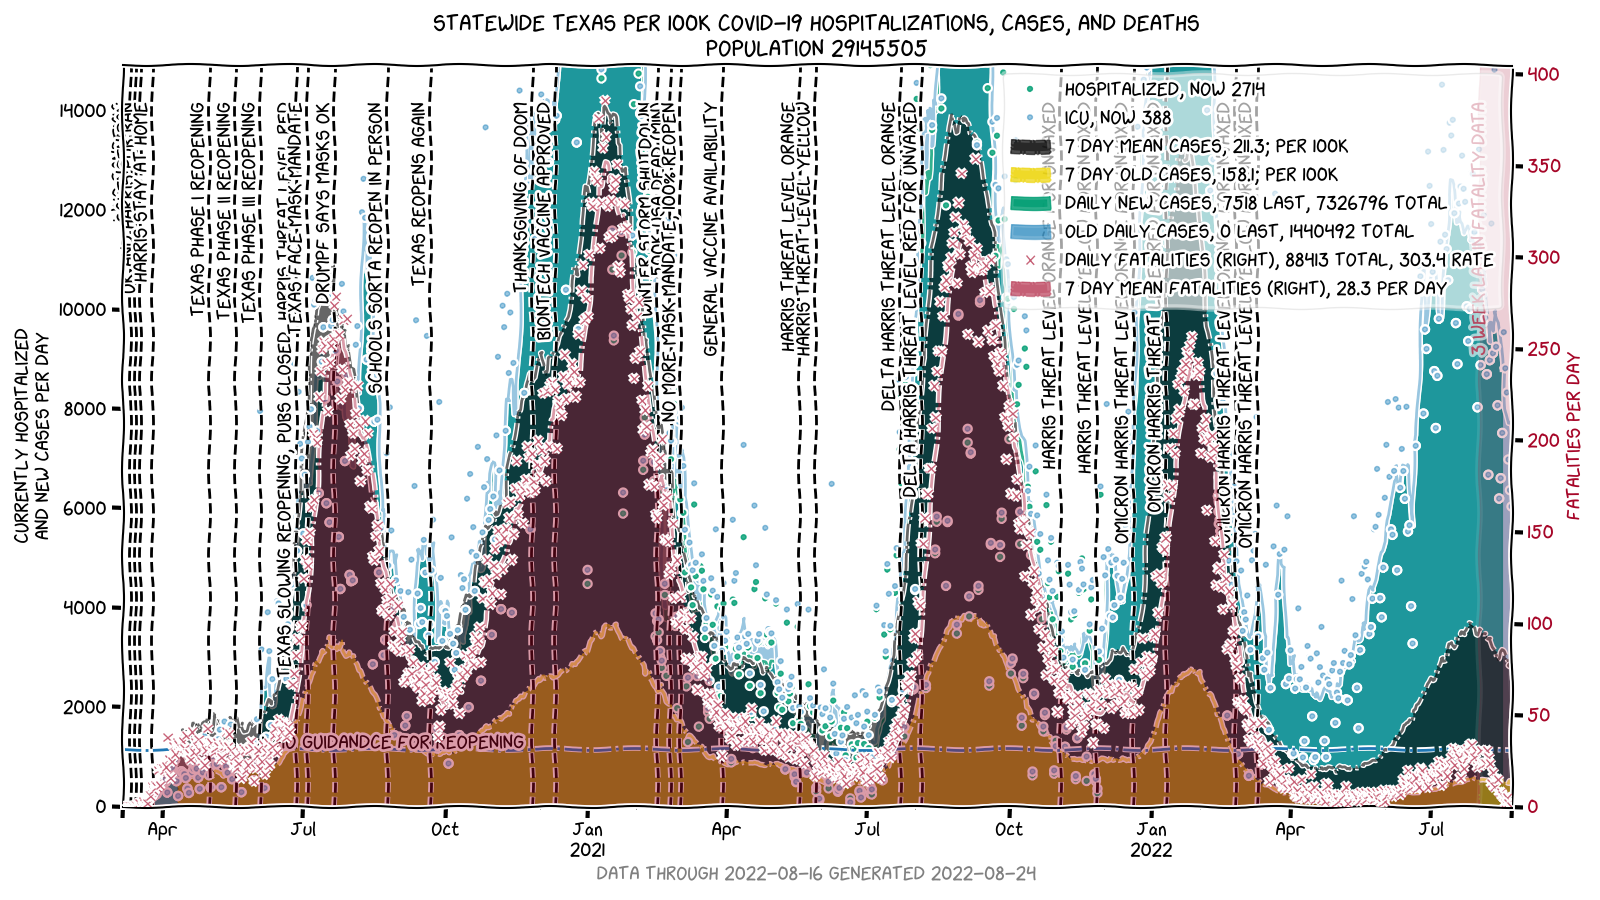
State totals


Houston Trauma Area


Dallas Ft.Worth Trauma Area


San Angelo Trauma Area


Rio Grande Valley Trauma Area


El Paso Trauma Area


Sources
Texas DSHS COVID-19 Additional Data
Texas Tribune COVID-19 summary
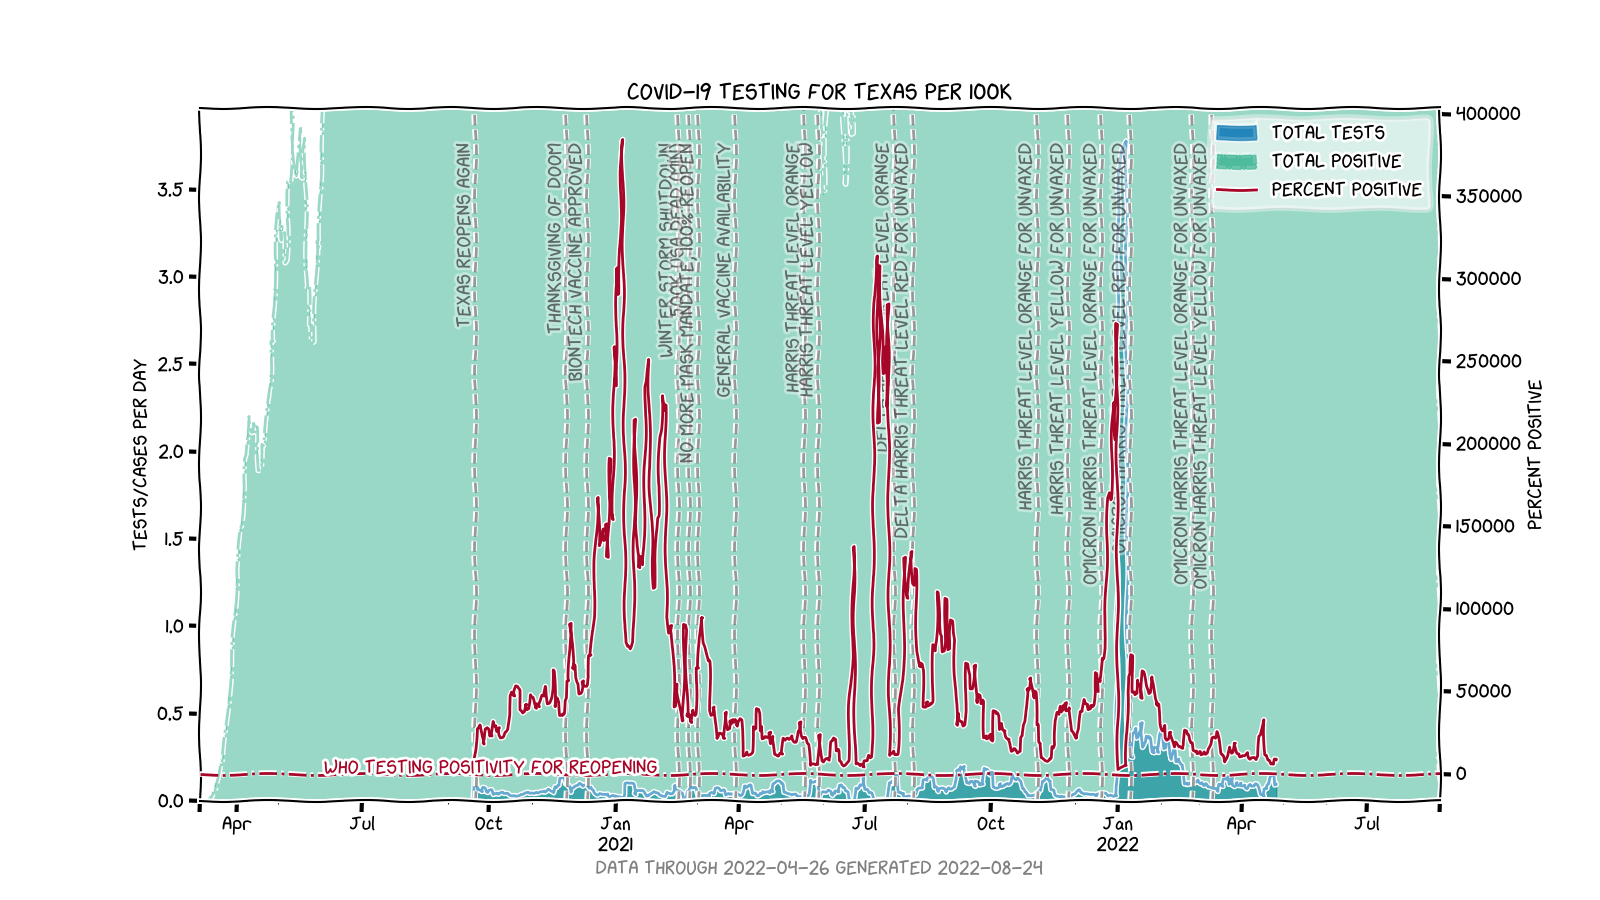
Widely accepted reopening guidelines
- 2-week drop in COVID-19 Cases
- Fewer than 4 new daily cases per 100k population
- 150 new daily tests per 100k population
- positivity rate of testing to be less than 5%
- 40% of ICU beds free to treat influx of new cases
- 7-Tagesinzidenz pro 100.000 Einwohner; 50 Fällen pro 100.000,
.rolling(7).sum()- Contact tracing and containment is possible below this level.
Texas' take on reopening guidelines
- 30k tests per day (100 tests per 100k population)
- Infection rate less than 6%
- look closely at hospitalization rates and death rates to see if it's safe to continue
- That rate reflects the number of hospitalizations that the state tallies on a given day over the cumulative total number of cases on that day, a formula that Abbott used at news conferences last month. While it is unclear if he is still using that formula to calculate the hospitalization rate, it is important to note it is imperfect because the cumulative total number of cases likely includes people who have recovered. 1
Other data

References and notes
- hospitalization data 80-90% incomplete on 07/22-07/28 due to new white house reporting guidelines bypassing the CDC
- 27 July - Fatality data no longer a daily metric with up to a 10-day lag for the death report to be tallied. Realisically, the lag seems to be greater than 21 days.
- tests performed appears to have a two day lag of reporting from publication date
- other data generally has a 1 day lag from publication
- from November, there is an additional probable case count published from non PCR tests.
Data quality
- Excels provided as time series data using dates as columns.
- Dates mixed with inconsistent prefixes and asterisks.
- some cases have to be
.split() - others need
.rstrip('*') - years need to be added to the string
- 27 July Fatalities corrected the date to excel style, shortly thereafter the cells become inconsistent
- year information inconsistent, 2021 will be here before it's gone
- some cases have to be
- comments in data areas append randomly
Tests Through August 32was entered on the September 2 tests data.- no date stamp on files from website, can't use
wget -Nto only download when new - have to check
.ctype == 2in case there's a non-numeric value in the cell - the TMC started providing their own [systemwide covid testing positivity trends]2 becasue the statewide numbers fluctuate so greatly
- These are good as they have a good basline of population exposed but not infected
- They also have a 24-48 hour turnaround time
- there is a very consitent number of tests performed day to day
- the fatality data spreadsheet variously changes between "TOTAL" and "GRAND TOTAL".. What's grand about that fellows?